eeg/ folder contains reports and visualizations generated during preprocessing.These outputs provide transparency, allow quality control, and make it easier to share results with collaborators who may not run the pipeline themselves.
Example Layout
File Descriptions
| File | Purpose | Example |
|---|---|---|
*_autoclean_report.pdf | Full QC report with preprocessing summary and visualizations. | View Report |
*_processing_log.csv | Run-specific log of preprocessing parameters (see Processing Log). | View Log |
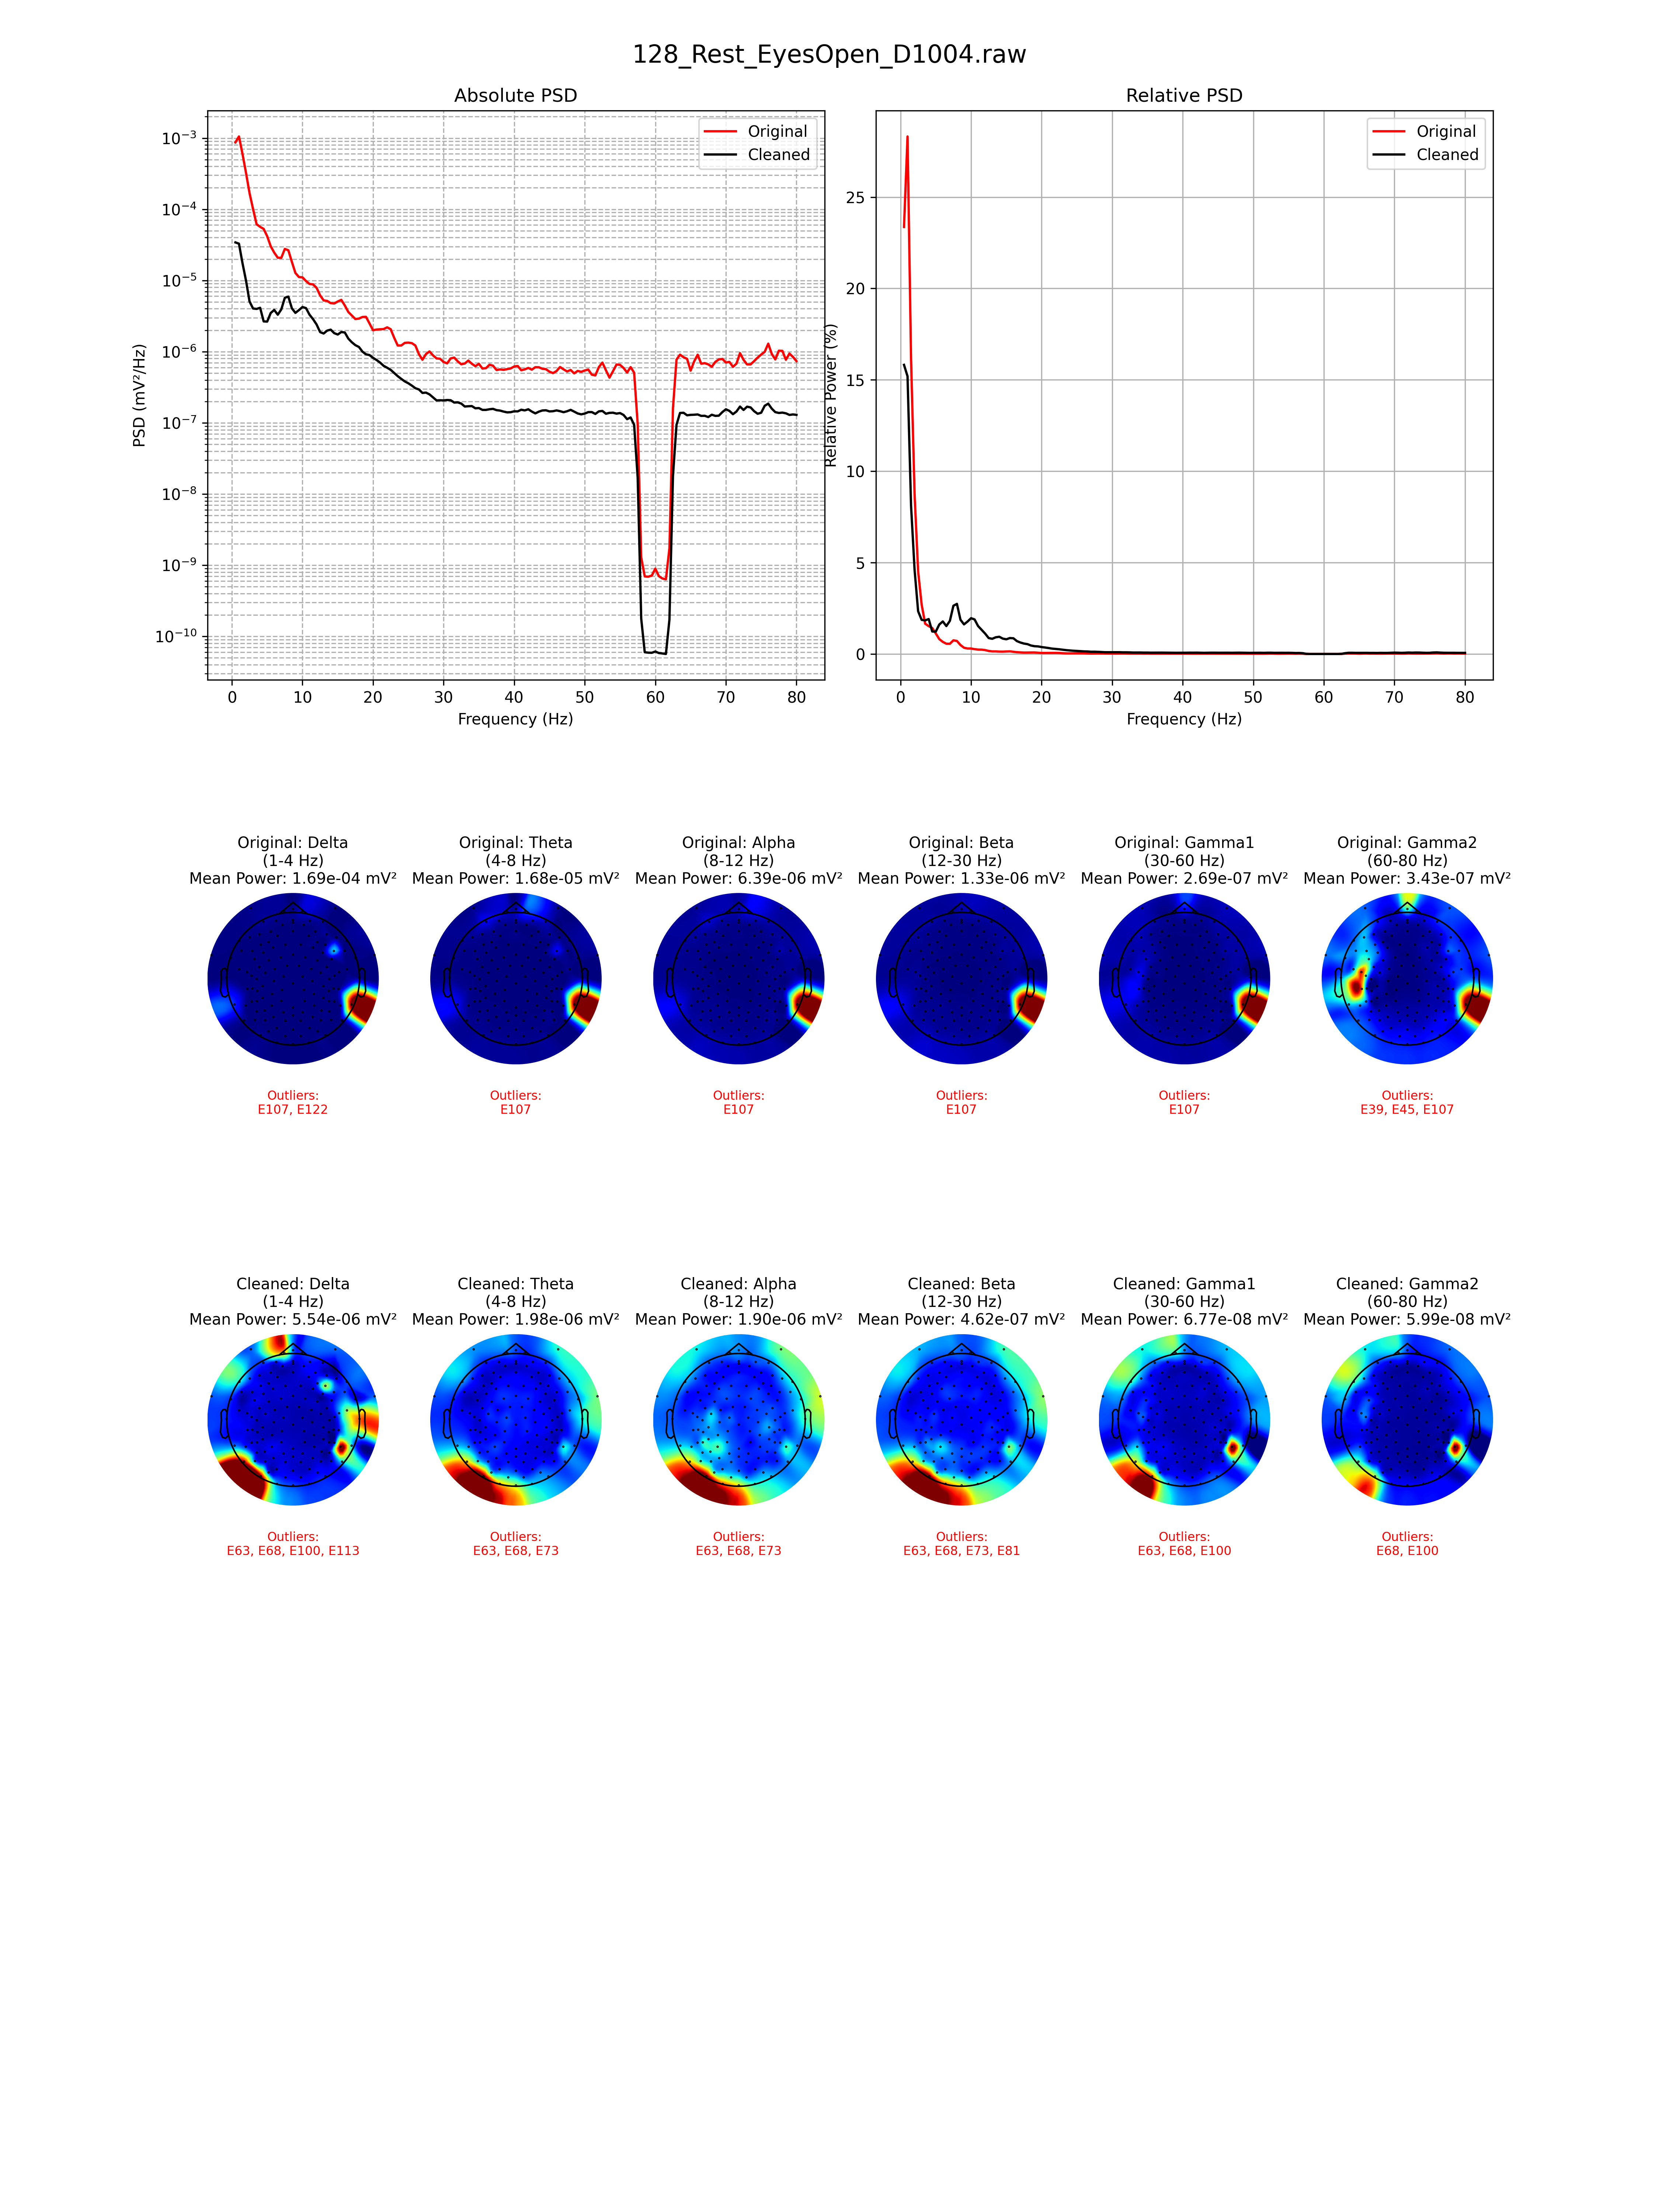
*_psd_topo_figure.png | Power spectral density (PSD) topography plot comparing raw vs. cleaned data. | View PSD Plot |
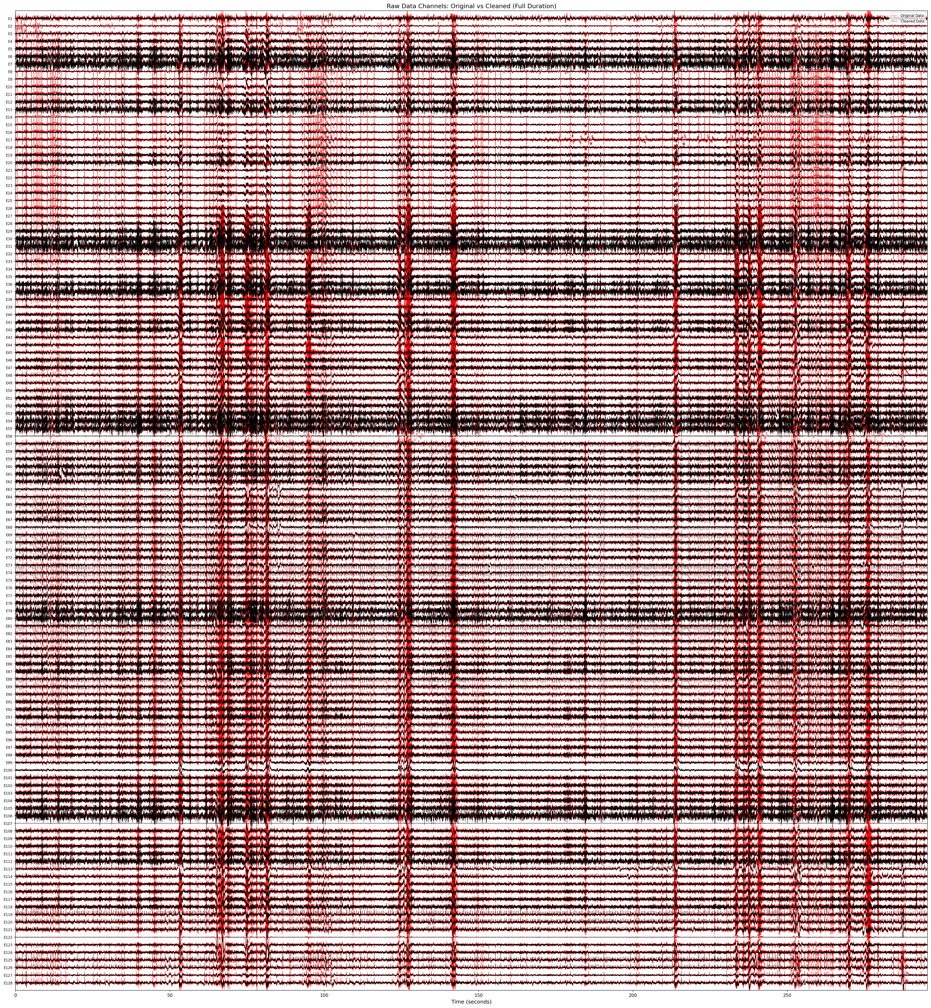
*_raw_vs_cleaned_overlay.png | Overlay of raw and cleaned signals for visual inspection. | View Overlay |
*-ica.fif | ICA decomposition weights in MNE format (stored separately from EEG). | Download ICA |
FlaggedChs.tsv | List of channels flagged as bad during preprocessing. | View Flagged Channels |
*_ica_components_all.pdf | Report showing ICA components and which were removed. | View ICA Components |
Visual Examples
PSD Topography Comparison

Raw vs Cleaned Signal Overlay

Why These Matter
- Quality Control (QC): Each run produces both text logs and figures for visual inspection.
- Transparency: Reports can be shared with collaborators or archived with publications.
- Reproducibility: The
.csvlog and.fifICA weights make it possible to rerun or reapply ICA later.
Subject-level reports are intended for human review.
They complement the standardized outputs in
They complement the standardized outputs in
derivatives/ and task‑root exports/.