The Problem: Limitations of Current Automated Methods
A Compelling Case Example: Cardiac Artifact Misclassification
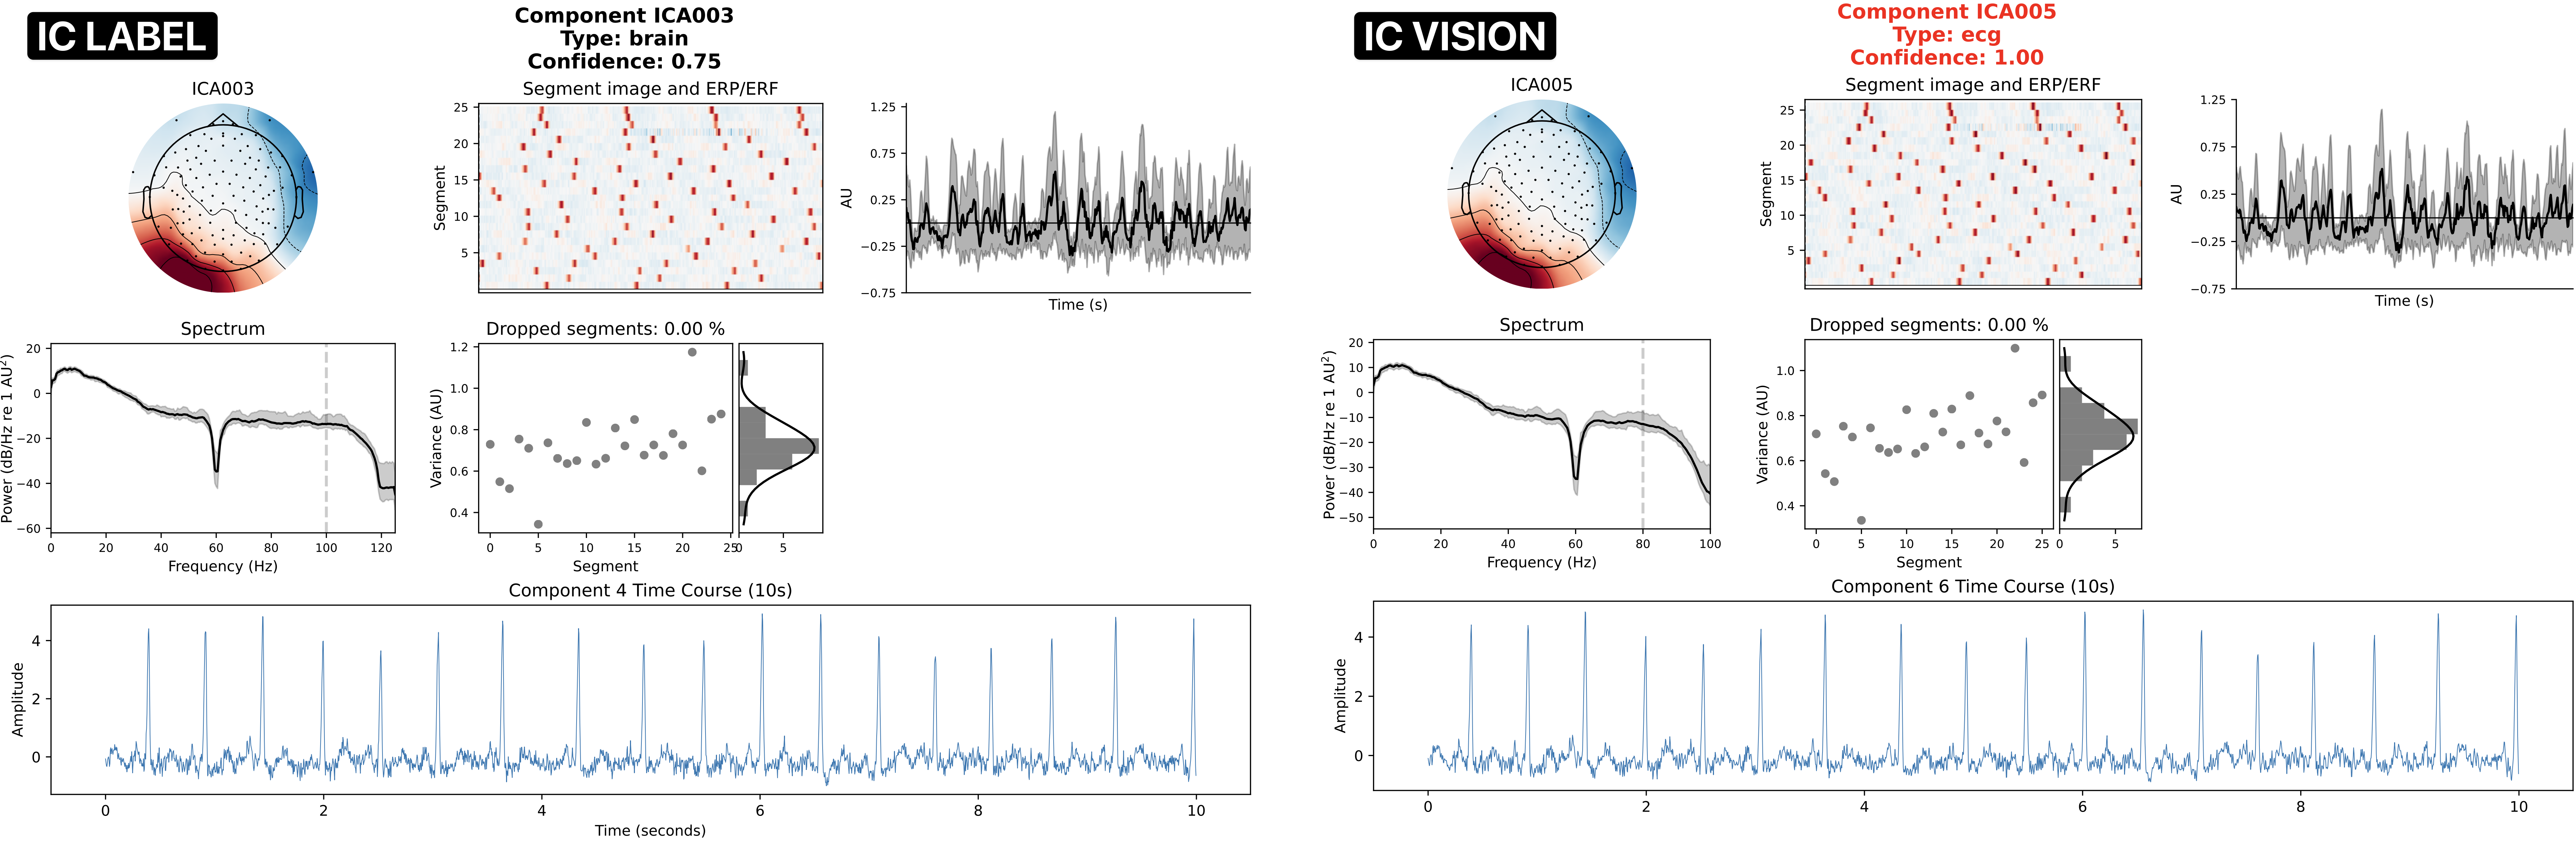
- Rhythmic ~1Hz oscillations in the time series (top right panel)
- Consistent temporal patterns across trials (bottom left panel)
- Frontal-posterior dipolar topography characteristic of cardiac artifacts (top left panel)
The Vision-Based Solution
ICVision addresses these limitations by implementing the same visual pattern recognition process that EEG analysts use—systematic inspection of multi-panel component visualizations to distinguish brain activity from artifacts. Rather than extracting mathematical features from the data, ICVision generates the same standardized visualizations used in manual analysis and applies computer vision models to identify diagnostic patterns.Methodological Rationale
Component classification in EEG analysis is fundamentally a visual pattern recognition task. Manual analysis requires integrating information from multiple complementary views:- Spatial topography patterns (dipolar vs. focal vs. edge artifacts)
- Temporal dynamics (rhythmic oscillations vs. transient changes)
- Spectral characteristics (1/f neural activity vs. muscle’s rising spectrum)
- Trial-to-trial consistency (reliable neural sources vs. sporadic artifacts)
Standardized Visualization Protocol
Each component is analyzed using a four-panel visualization format, following established conventions from EEGLAB:- Topography (Top Left): Spatial distribution across the scalp for identifying dipolar brain sources vs. edge artifacts
- Time Series (Top Right): Initial 2.5 seconds of component activation revealing characteristic temporal patterns
- Continuous Data Segments (Bottom Left): Trial-by-trial consistency analysis distinguishing reliable sources from sporadic noise
- Power Spectrum (Bottom Right): Frequency content analysis essential for detecting muscle artifacts and neural oscillations
The Classification Algorithm
Data Preparation
ICVision loads your preprocessed EEG data and ICA decomposition (supporting both MNE-Python and EEGLAB formats). The software automatically detects ICA data embedded in EEGLAB
.set files, eliminating format conversion hassles.Parallel Visualization Generation
Components are plotted in batches using matplotlib with optimized memory management. Each plot maintains consistent scaling and layout to ensure reliable classification across datasets.
Concurrent API Classification
Multiple components are classified simultaneously using OpenAI’s vision API. The system sends the component image along with a carefully crafted prompt that encodes decades of EEG expertise into classification rules.
Intelligent Label Assignment
Each component receives one of seven standardized labels with an associated confidence score:
- Brain: Neural activity with dipolar patterns in central/parietal/temporal regions
- Eye: Periocular artifacts from blinks and eye movements
- Muscle: High-frequency contamination from facial/neck muscles
- Heart: Cardiac artifacts with ~1Hz rhythmic patterns
- Line Noise: 50/60Hz electrical interference
- Channel Noise: Single electrode failures or poor contact
- Other Artifact: Complex artifacts not fitting clear categories
Automated Artifact Rejection
Components classified as artifacts (confidence ≥ 0.8 by default) are automatically marked for exclusion. The ICA object is updated with both MNE-compatible labels and exclusion lists.
The Classification Prompt: Encoding EEG Expertise
The classification prompt is the heart of ICVision—it encodes the decision-making process that EEG experts use when visually inspecting components.
- Priority Rules
- Scoring System
- Heart Detection First: Any ~1Hz rhythmic pattern immediately triggers heart classification
- Channel Noise: Single focal spots without dipolar structure indicate bad electrodes
- Eye Artifacts: Dipolar patterns confined to periocular regions (Fp1/Fp2/F7/F8)
- Line Noise: Sharp peaks (not notches) at 50/60Hz
- Muscle: Rising power spectrum at high frequencies—the definitive muscle signature
- Brain: Dipolar patterns in cortical regions with 1/f spectrum
- Other: Everything else, including complex or ambiguous patterns
Addressing Common Concerns
Human-Computer Collaboration
ICVision is designed to augment rather than replace expert judgment in EEG analysis:Consistency
Unlike humans who may classify differently when tired or rushed, ICVision applies the same criteria consistently across thousands of components.
Transparency
Every classification includes detailed reasoning, allowing you to understand and verify the AI’s decision-making process.
Speed
Process 100 components in under 2 minutes—a task that would take an expert 30-60 minutes of careful inspection.
Adjustability
Customize confidence thresholds, exclusion criteria, and even the classification prompt itself to match your specific requirements.
Built-in Safeguards
Conservative Default Settings
Conservative Default Settings
- Confidence threshold of 0.8 ensures only clear artifacts are auto-excluded
- Brain components are never excluded unless explicitly configured
- All classifications are logged with detailed reasoning for audit trails
Visual Verification
Visual Verification
The PDF report includes all component visualizations alongside classifications, enabling quick visual verification of results. Any questionable classifications can be easily identified and manually corrected.
Fallback Mechanisms
Fallback Mechanisms
- Failed API calls default to “other_artifact” with confidence 1.0
- Malformed responses are caught and logged
- Batch processing continues even if individual components fail
Comparative Performance Analysis
Traditional automated methods rely on extracting numerical features (kurtosis, entropy, autocorrelation) and training classifiers on these abstractions. This approach can lose the rich spatial-temporal-spectral relationships that make visual inspection effective for expert analysts.
Methodological Advantages
- Integrated Pattern Analysis: The vision-based approach processes spatial, temporal, and spectral information simultaneously, mirroring expert visual analysis workflows.
- Robustness Across Recording Conditions: Vision models can recognize diagnostic patterns despite variations in electrode montages, sampling rates, or preprocessing parameters.
- Transparent Decision Process: Classification decisions are based on interpretable visual features that can be independently verified by researchers.
- Scalable Methodology: The approach benefits from ongoing advances in computer vision without requiring retraining or workflow modifications.
Practical Considerations
API Costs
Typical cost: $0.002-0.004 per component with GPT-4-Vision
Processing Time
~1-2 seconds per component with parallel processing
Accuracy
85-95% agreement with expert labels in validation studies
Integration with Your Workflow
Summary
ICVision implements a vision-based approach to automate the visual pattern recognition process that has been the established standard for ICA component classification. By applying computer vision models to the same multi-panel visualizations used in manual analysis, this method offers several advantages:- Enhanced scalability for larger datasets while maintaining classification quality
- Standardized methodology across studies and research groups
- Complete documentation of classification criteria and decisions
- Reduced manual annotation burden allowing focus on data interpretation
Implementation Guide
Learn how to integrate ICVision into your EEG analysis workflow.